We have been working recently on improving the graphing interface to make it easier to use! Let’s see what has been changed in the last couple of months:
Independent zooming of the axes: this was one of the most frequently asked feature and we added it. From now on, you can zoom the x and y axes separately. There is a setting in the overflow menu controlling this option.
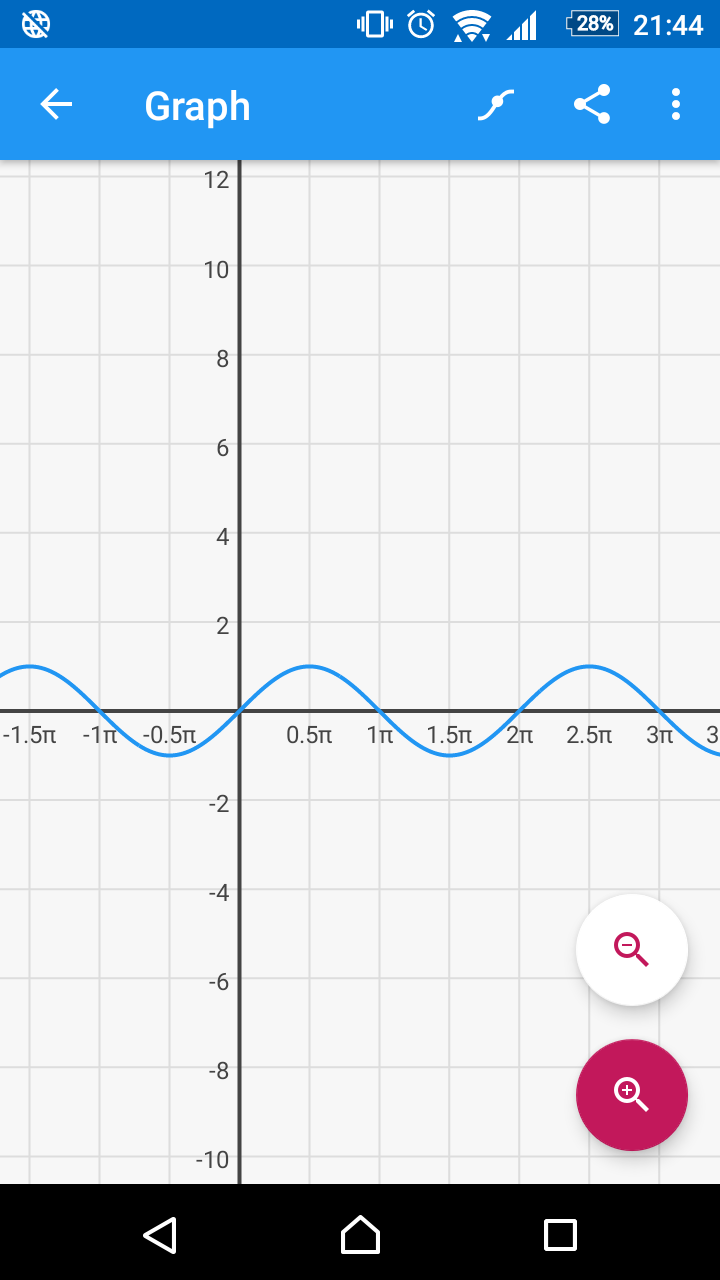 Ticks as multiples of pi: you can also set in the settings that the helper lines in the graph appear at multiples of pi. This makes much easier to work with trigonometric functions that use radians as input. For example try to plot sin! On the screenshot to the right, you can easily see that the function has roots at integer multiples of pi and has minimums/maximums at half integers.