
It’s been a while since we wrote a summary on the new features in the calculator. In this post, I’ll collect the latest updates.
Let’s start with the function that most people asked for: basic statistical and probability functions! You can calculate standard deviations, medians and means in the new version. Also, to save you keystrokes, the normal function gives you the density function of the Gaussian distribution.
The second biggest news is the addition of parametric functions. Parametric functions allow you to express a plot not as a strict x->y map but as a general curve. The best example is the movement of a car. Let t be the current time, starting from 0. Then, we can plot the path of the car if we now where the car was at time t. Only thing we need to do is to specify the x(t) and y(t) functions that describe the x and y coordinates of the car after t seconds has passed.
Parametric curves are best used to visualize physical models that have a time component. These plots can show you, how your problem changes as time goes ahead.
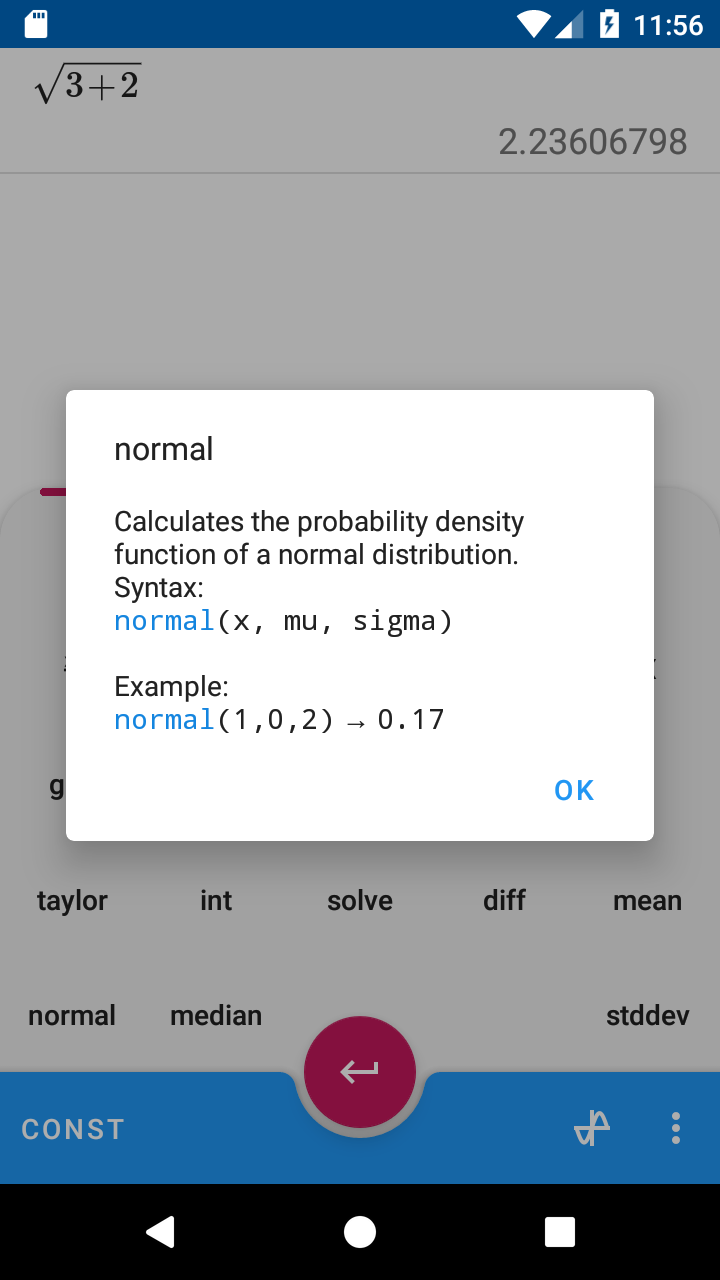
Finally, I’d like to give you a tip on how to use the calculator. We introduced quick help texts that appear when you long click on a button. For example, the image shows you the description of the normal function. In the future, if you forget how to use a function, just press on it, and you’ll get a quick reminder with examples.